Statistics&Probability: Significance Tests
Statistics&Probability: Significance Tests
Statistical Significance
Here is a link for a study:
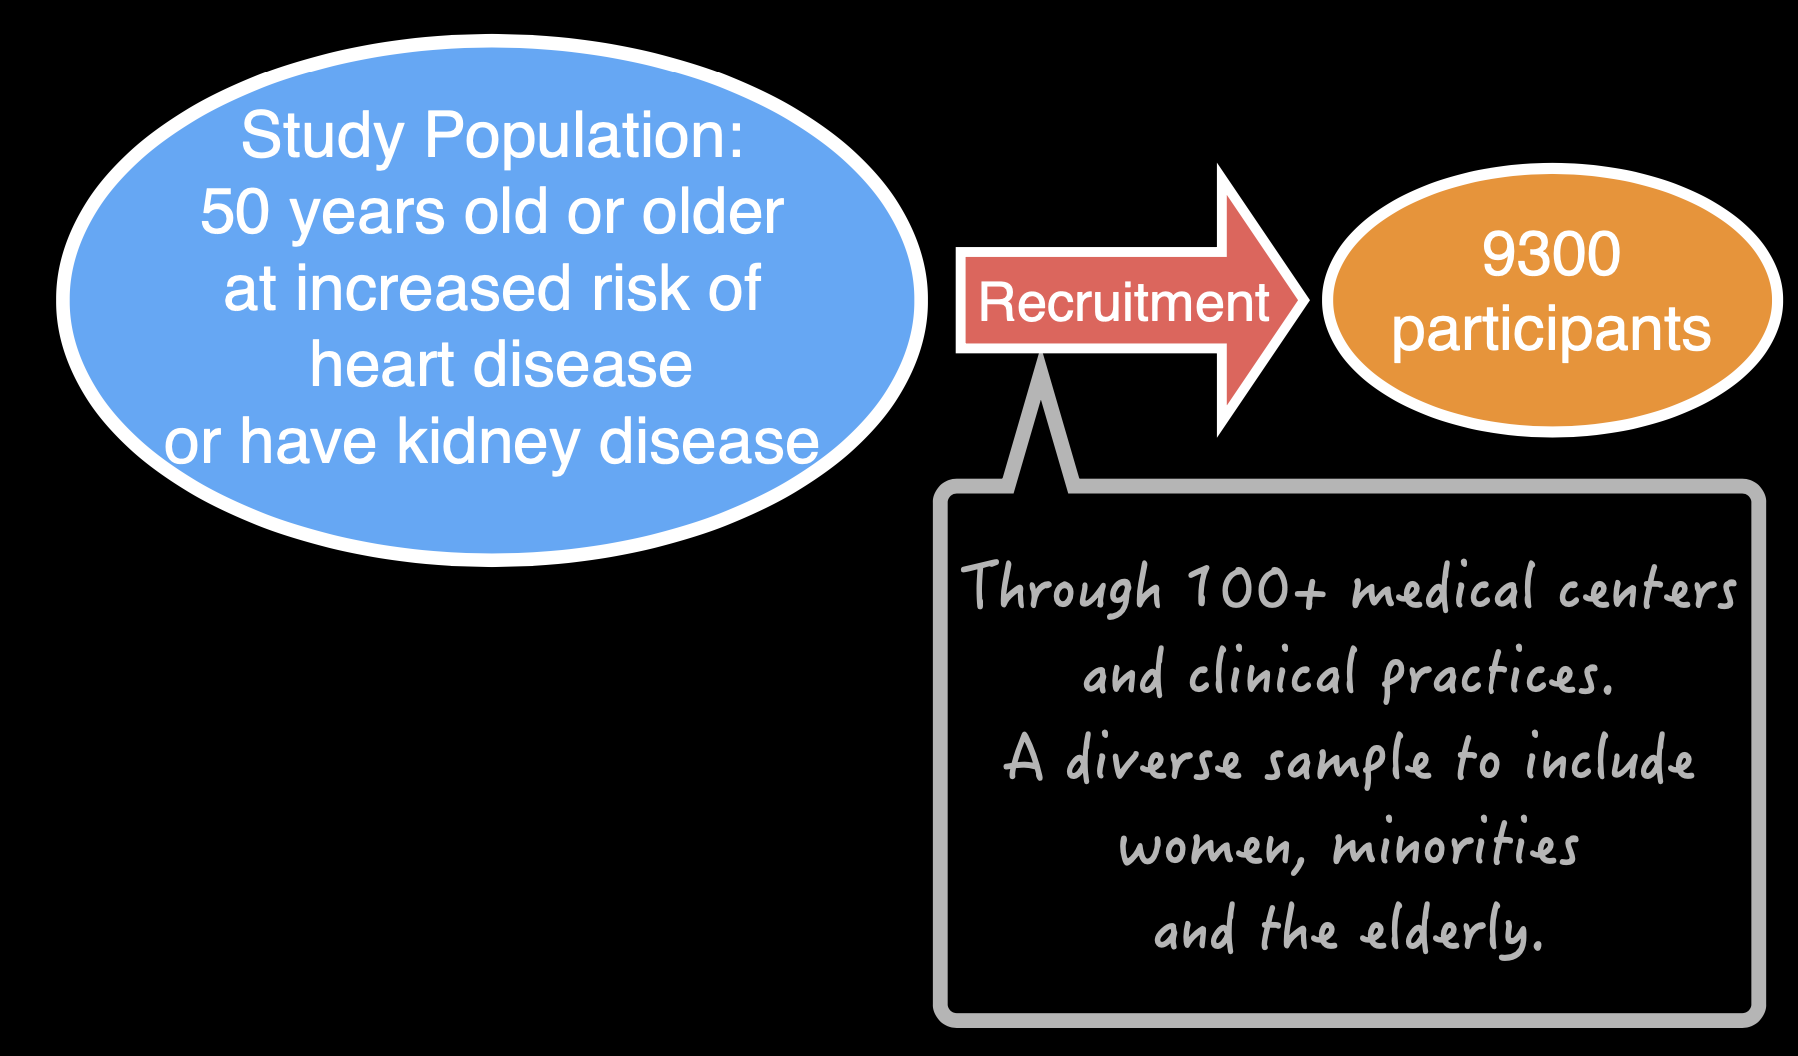
The above study concerns a population of individuals. The population they want to study
is patients who are 50 years old, or order, and at an increased risk of heart disease and/or kidney disease.
This is a large population, and we need to select a small set of individuals to carry out the comparison of different treatments. Therefore, the first step of the study is recruitment. The recruitment is done through more than 100 medical centers and clinical practices to derive a diverse sample of women, minority, and elderly. The reason for that, is different individuals in the population may have different probability of being selected if the sample is carried out randomly. To create a more representative sample, sometimes we need to design sampling strategies to have better coverage.

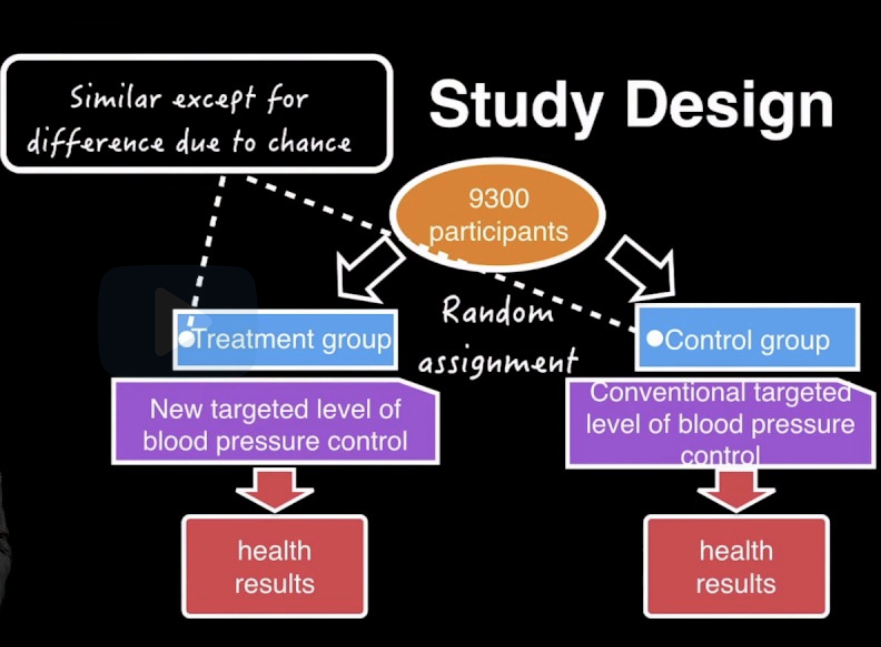
After this requirement, we need derive a small set of individuals who will participate in the study– about 9,300 of them. After the recruitment, our focus will be on these 9,300 participants instead of the entire population out there, even though our conclusion will hopefully be applicable to the entire population under study. The design of study is summarized as following:

As shown, you have 9,300 participants. The first step after the start of the study is random assignments. So you will assign these 9,300 participants into two groups randomly. The first group is a treatment group. The second group is a control group. And these two groups are created so that they’re similar, except for differences due to chance.
The reason why they may be different is these 9,300 are all different. They’re all individuals.They all have their own environmental factors, demographic background, and their individual profiles. They have different values for age, for height, for weight, for health habits, for their occupation risks, so on and so forth. So they’re all different. In the random assignment they will be randomly put in treatment group and control group. Therefore, the two groups will have some random differences because they have different individuals.
Then, after the group assignments, the two groups of individuals will receive different treatments. In the treatment group, you will receive a new targeted level of blood pressure control. In the control group, you will receive a conventional target level of blood pressure control.
In this study, this target level of blood pressure control are achieved using a whole array of medical assistance. So that is not part of the difference between the two groups. The difference between the two groups is their targeted level of blood pressure. So after a certain period of treatments, we will observe and measure the health results from the two groups, and then we’ll compare them.
Then we will observe some differences, because these two different individuals received
two different treatments. So now the scientific question, and the question for the statistician who will analyze this data, is whether this difference can be explained purely by chance. Can we observe difference in health results, even these two treatments have no difference in effects? Can this different be purely explained by chance?
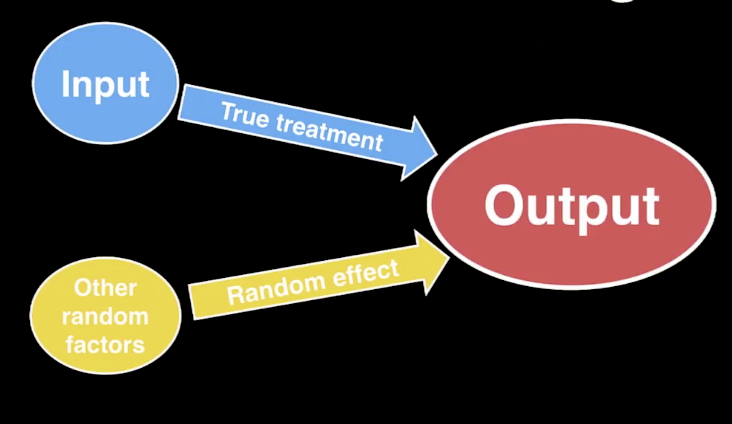
Here we have input, which is the different treatments and blood pressure management, and we want to study its true effect on the output, which is the health results based on blood pressure control. But at the same time, we know that there are other random factors that may have random effects on the outcome, such as the age of the participants, the other health habits and occupation risks, and the environmental factors that could potentially affect the outcome.

So our question is, as a statistician, how do we carry out the statistical inference so that we can estimate the extent of the random effects, and then use that to establish the size of the true effect? And the other way to say this exercise is, how we evaluate the observed effect so that we can say whether it is likely to occur purely by chance? That whether is it possible the two groups look different because they started off, after the random assignment as different groups, then they will exhibit different health results at the end of the study– whether we can observe that. If it’s very unlikely to observe a certain level of differences, we will call it statistically significant. Which is a way of saying that the effect is so big that we do not think that it can be explained purely by chance, and we believe part of it is due to a really existing true effect from the treatments.
Statisticians using statistical method establishes the statistical significance of observed signal by studying randomness.
Hypotheses
Significance tests work with hypotheses. A hypothesis is a statement about the population that we try to collect evidence to prove or disprove.
For example, now we want to test whether a coin is biased or not. And our hypothesis is the following statement:
The coin is fair.
We know that a fair coin produces heads 50% of the time. To check the fairness, we need to collect and observe data. The data we observe come from 10 tosses using this coin. Suppose in the 10 tosses, 10 heads are observed.
If the coin is fair, the probability of observing 10 heads is:

Then the question is whether this evidence – we collected 10 heads for 10 tosses – is a statistically significant evidence against the statement that we want to check.
This is the logic we want to exercise in a significance test:
We have a statement, in this case,
the coin is fair.We have a model generated according to the statement, i.e.,
a fair coin produces heads 50% of the time.We check the
consistencyof the statement with the data we collected. This consistency is usually measured by a probability. In our case, if the statement is true, the probability of observing 10 heads is less than 0.001.Then we ask ourselves:
Is this probability small enough for us to question the validity of our statement?
In practice, we use p-value as our probability. P-value is a probability assuming the null hypothesis is true. And we reject the null hypothesis when the p-value is small enough.